> For the complete documentation index, see [llms.txt](https://docs.imerit.net/llms.txt). Markdown versions of documentation pages are available by appending `.md` to page URLs; this page is available as [Markdown](https://docs.imerit.net/core-concepts/projects.md).

# Projects

<figure><picture><source srcset="https://angohub-docs-assets.s3.eu-central-1.amazonaws.com/cover/projects-dark.png" media="(prefers-color-scheme: dark)"><img src="https://angohub-docs-assets.s3.eu-central-1.amazonaws.com/cover/projects.png" alt=""></picture><figcaption></figcaption></figure>

Projects are the main way to organize and distribute labeling tasks in Ango Hub.

In projects, project owners, [managers](/labeling/managing-users-in-projects.md#managers), and leads can upload up to 200k [assets](/core-concepts/assets.md), add annotators, add [reviewers](/core-concepts/reviewing.md), create label sets (annotation ontologies), export their results, and more. Everything done in Ango Hub is done within projects.

## Project Dashboard

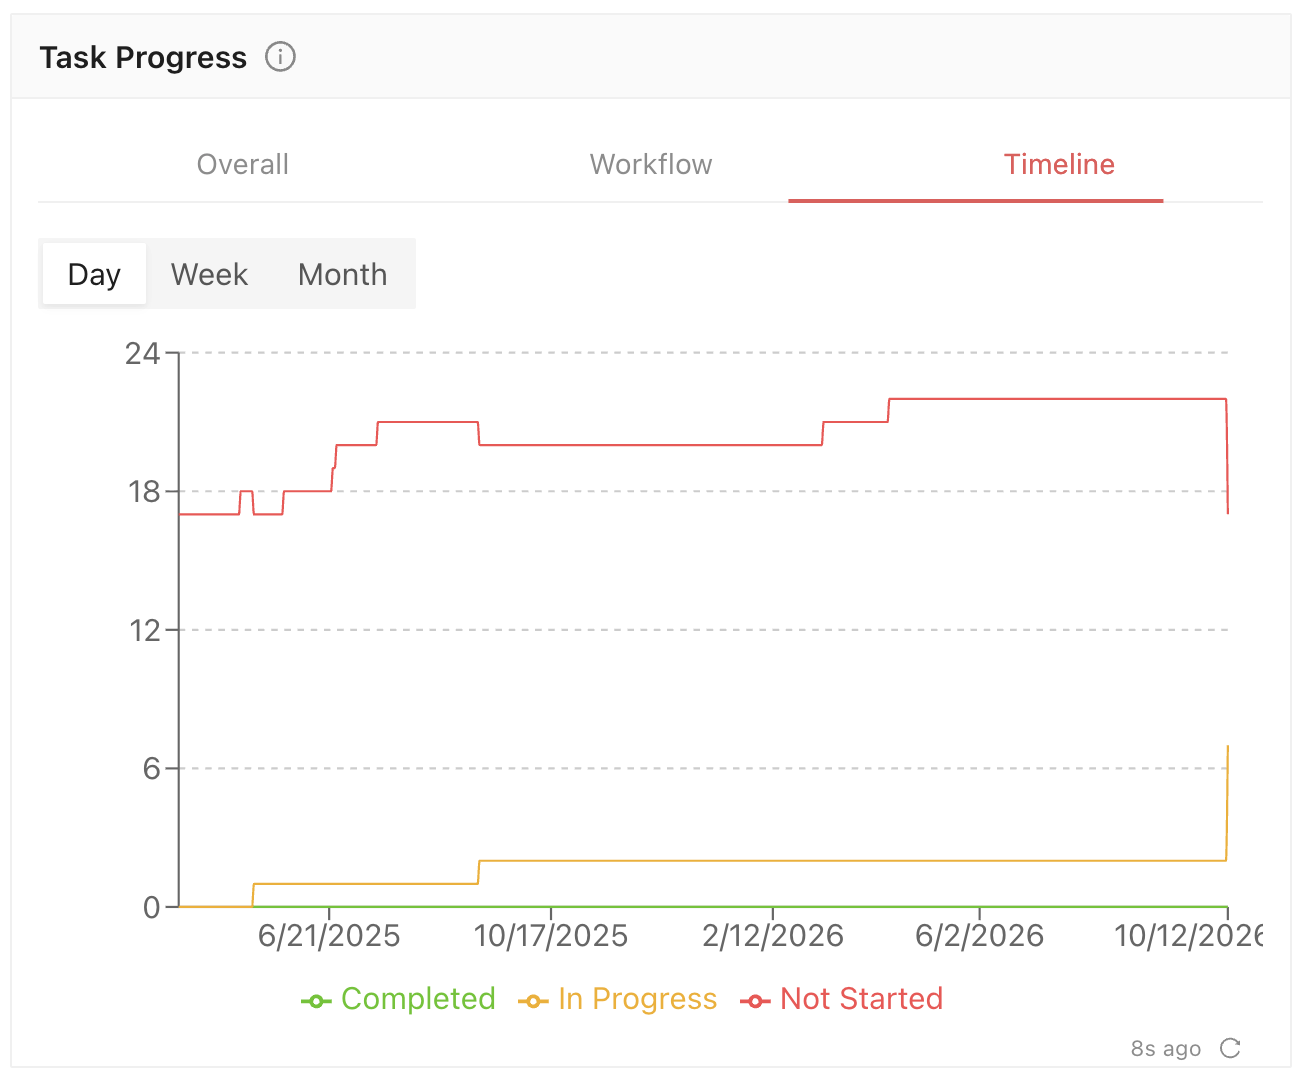
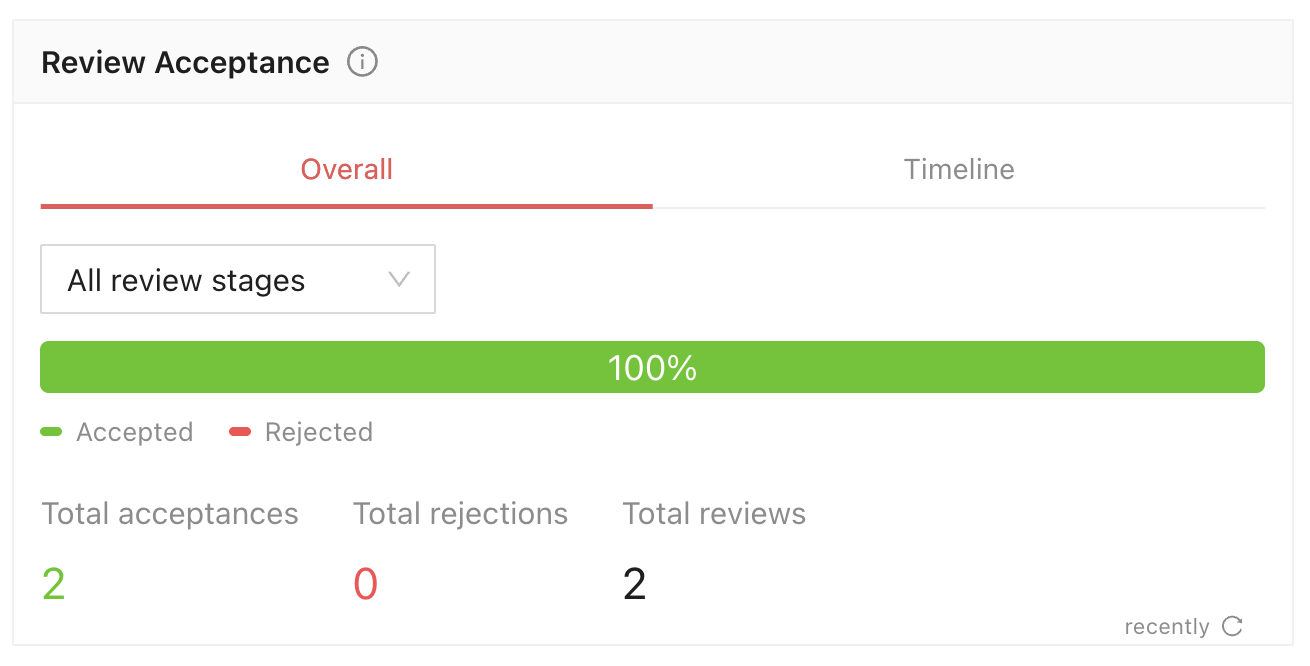
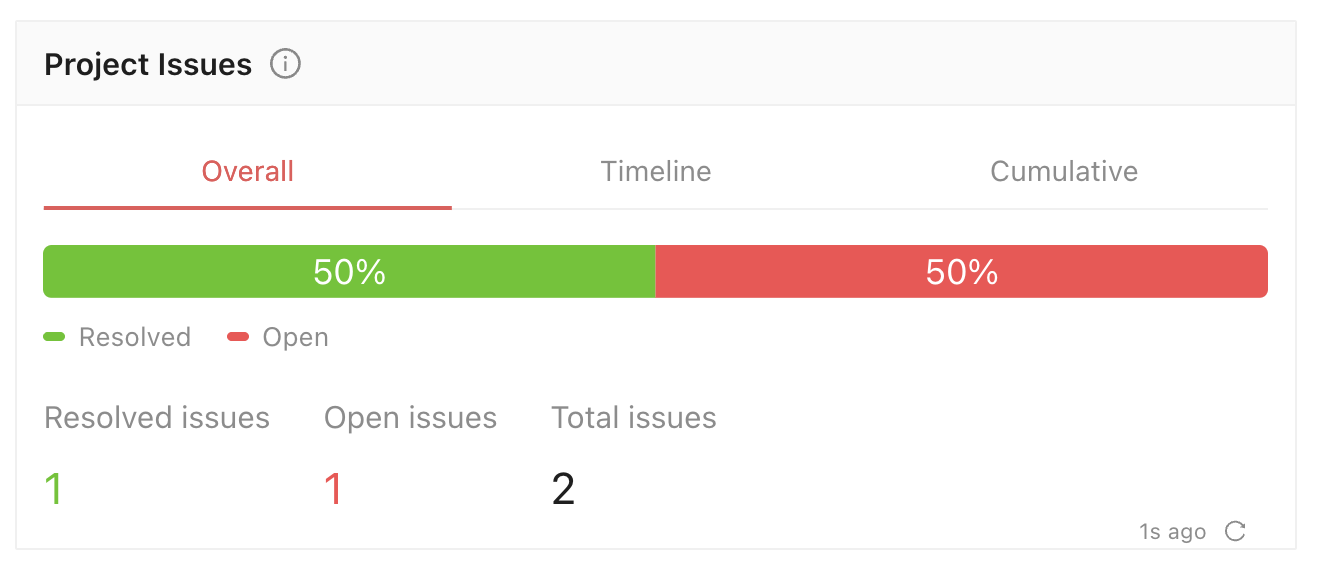
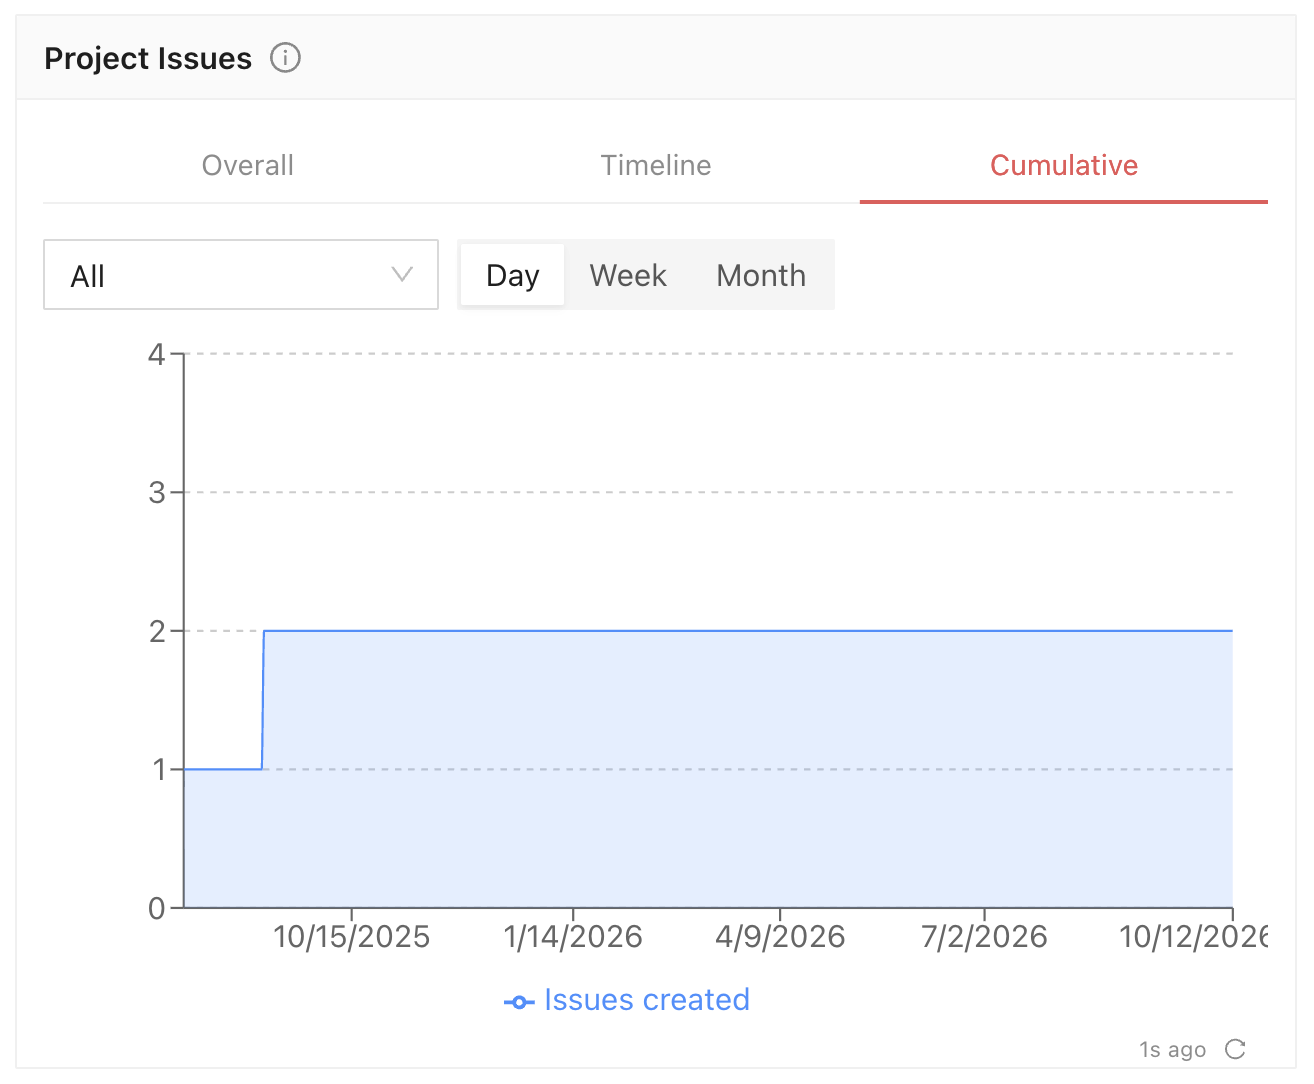
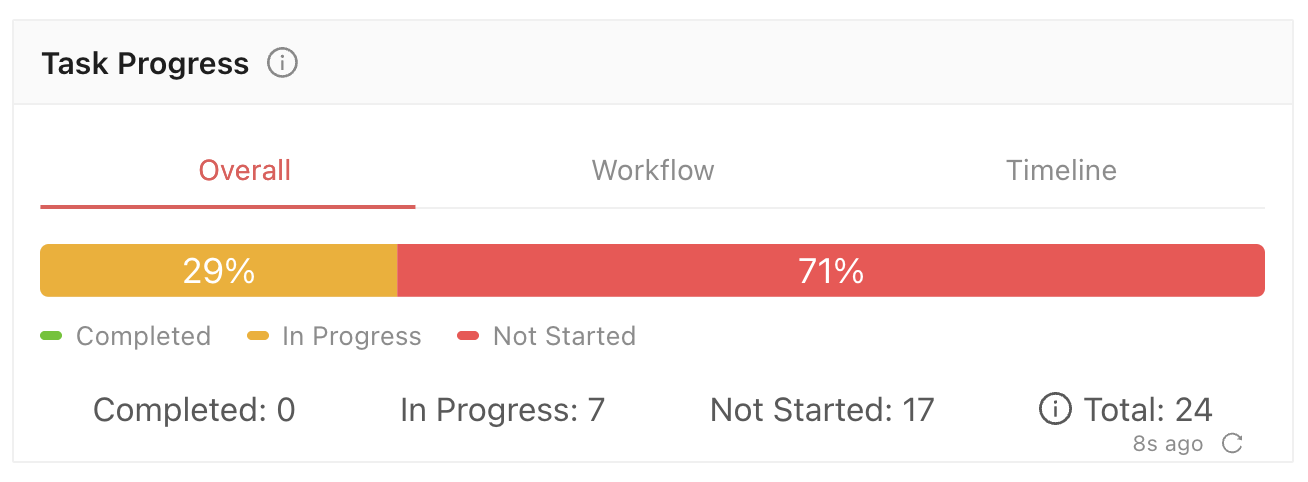
Every project opens on the *Dashboard* tab. The Dashboard summarizes task progress, duration, annotations, and other project statistics in a set of widgets. Use the date and batch filters at the top of the page to limit the data shown in the widgets.

Labelers and reviewers see statistics for their own work. Leads, managers, and project owners can switch between project-wide and personal statistics.

In the *Annotation Count* widget, *Overall* counts annotations currently present in the project's tasks. *Me* counts annotations you contributed across task history, including annotations that were later changed or removed in a subsequent workflow stage. As a result, your personal annotation count can be higher than the overall count.

### Burndown Chart

The *Burndown Chart* tracks the project's total scope, completed tasks, and remaining tasks over time. It is hidden by default; leads, managers, and project owners can add it from the *Widget Library* as described below.

<figure><img src="/files/63NY5NZh3bQCrb8d31cC" alt="Project Dashboard Burndown Chart grouped by day and shown as a percentage"><figcaption><p>The Burndown Chart can display task counts or percentages.</p></figcaption></figure>

Use the controls above the chart to:

* **Group by** day, week, or month. This changes both the chart intervals and the recent-progress window used for the projection.
* **Show** task counts or percentages. Percentages are calculated against the project's scope at each point in time, so adding tasks can raise the remaining percentage.

When the project has enough recent progress, the widget shows an estimated completion date and the current completion velocity. The estimate uses the latest 14 chart intervals, so changing *Group by* can produce a different date. If the project is complete, has too little history, or has no recent progress, the widget explains why a date cannot be projected.

The Burndown Chart follows the Dashboard date and batch filters. The date range limits the period shown without resetting the task totals accumulated before its start; the completion projection still uses the full history of the matching tasks. Archived tasks count as completed automatically. Completion dates are based on each task's last update, so a task edited after completion appears on the date of that edit. Tasks without a usable timestamp are excluded.

### Customizing the Dashboard

Leads, managers, and project owners can customize the project-wide Dashboard:

1. Hover over a widget to display its controls.
2. Drag the handle to move the widget, or click the `x` to remove it from the Dashboard.
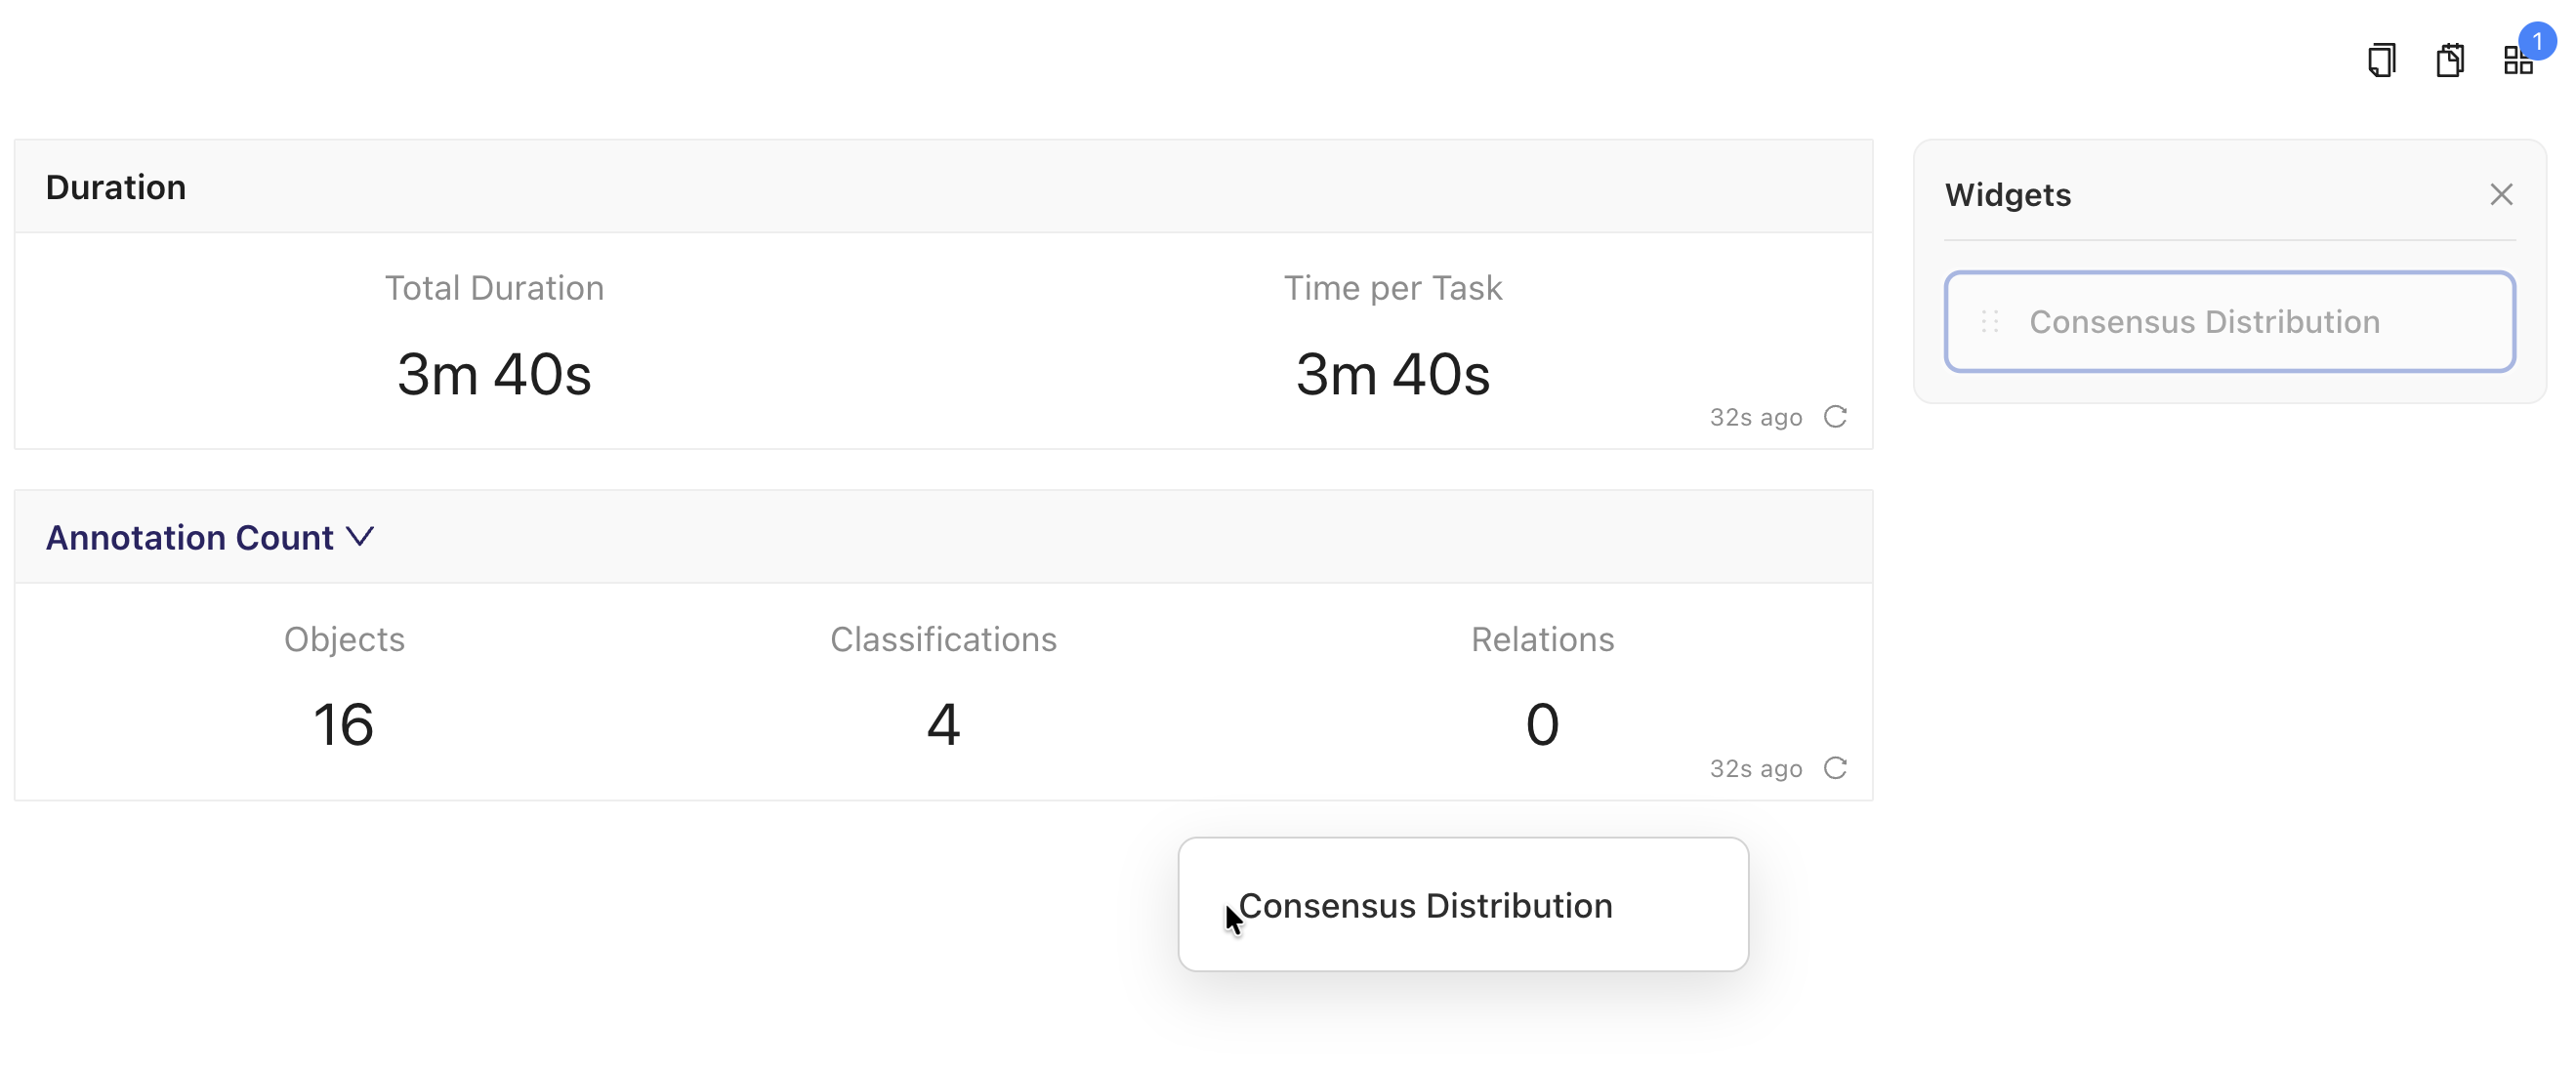
3. To restore a removed widget, click *Widget Library* in the top-right corner and drag the widget from the panel onto the Dashboard.

<figure><img src="/files/eCOB5r6gG4qFhlsmgL87" alt="Annotation Count Dashboard widget showing its drag and remove controls"><figcaption><p>Hover over a widget to display its drag and remove controls.</p></figcaption></figure>

<figure><img src="/files/lYIQzCpHy50cSWuv40ui" alt="Project Dashboard with the Widgets panel open and Consensus Distribution being dragged onto the Dashboard"><figcaption><p>Drag a widget from the Widget Library to restore it to the Dashboard.</p></figcaption></figure>

The Widget Library only lists widgets available for the current project. For example, *Consensus Distribution* is available only when the project's workflow includes a Consensus stage.

To reuse a layout in another project, click *Copy Layout*, open the other project's Dashboard, and click *Paste Layout*. *Copy Layout* places the layout on your system clipboard, so you can also send the copied text to another user. After they copy the shared text to their clipboard, they can click *Paste Layout* on their project's Dashboard. This copies the widget order and which widgets are visible; it does not copy project data or filters.

{% hint style="info" %}
Applied Dashboard layouts are stored in your current browser, separately for each project. They do not change the Dashboard for other users or sync to other browsers or devices unless the layout is copied and shared as described above.
{% endhint %}

## Managing Projects in Ango Hub <a href="#creating-projects" id="creating-projects"></a>

### Creating Projects <a href="#creating-projects" id="creating-projects"></a>

From Ango Hub’s *Projects* page, click on “Create Project” on the top right or the center.

![](/files/MNKNpjme7YlnWcnbO7Xn)

A dialog will pop up asking to input the project type, name, and description. Click on *Create Project* at the bottom to create your project. In most cases, you will want to use *Standard* projects. If you need to annotate 3D Multi-Sensor Fusion data such as point clouds, then select *3D Multi-Sensor Fusion*.

<figure><img src="/files/3y8oyV5iwgKpL6EKQoUh" alt="" width="563"><figcaption></figcaption></figure>

#### Importing Sample Projects

Organization admins can click *Import Sample Projects* on the *Projects* page to add one or more ready-to-use examples to their organization. Select the samples you want, then click *Load Samples*.

Imported samples retain their existing batches, label validation settings and rules, and project issues. This lets you explore their configured workflows without recreating the sample setup.

### Pinning Projects <a href="#deleting-projects" id="deleting-projects"></a>

You may pin projects to the top of your project list for easy access.

{% hint style="info" %}
Pinning a project will only pin it for your specific user account.

Other members of your organization will not see your pin.
{% endhint %}

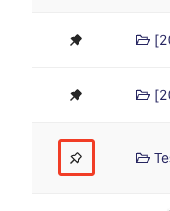
To pin a project, hover over the left side of the row of the project you'd like to pin. A pin icon will appear. Click on it to pin the project.

<figure><img src="/files/8I6yjSog5uuhnjmFjqew" alt=""><figcaption></figcaption></figure>

### Project Tags <a href="#project-tags" id="project-tags"></a>

Organization admins can create tags and use them to organize projects on the *Projects* page. Project tags are shared across the organization.

To manage the tags available in your organization, open the *Projects* page and click *Manage Tags*.

<figure><img src="/files/MjONtAoWnXIzIdEjoI0D" alt=""><figcaption></figcaption></figure>

From the *Manage Tags* dialog, you can create, rename, and delete project tags.

{% hint style="info" %}
Deleting a project tag removes it from the organization and from every project where it was used.
{% endhint %}

To add tags to a project, click the three dots in the same row as the project and click *Add Tags*. Select one or more tags, then click *Add Tags*.

<figure><img src="/files/0PZiz3t4N8C9qgaXs54L" alt=""><figcaption></figcaption></figure>

Projects with tags show them in the *Tags* column of the project list. Admins can remove a tag from a project by clicking the `x` on the tag.

<figure><img src="/files/sfWgGMLWhHt2W6Kylxwx" alt=""><figcaption></figcaption></figure>

When your organization has project tags, the *Projects* table also includes a *Tags* filter, letting you filter the project list by one or more tags.

### Cloning Projects <a href="#deleting-projects" id="deleting-projects"></a>

You may clone a project to create a duplicate of it.

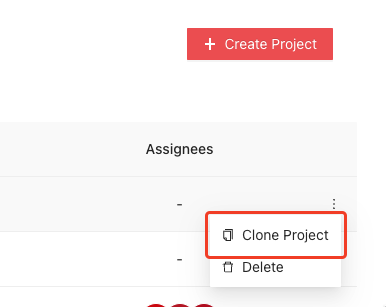
To clone a project, from the *Projects* page, click on the three dots in the same row as the project you wish to clone and click on *Clone Project*.

<figure><img src="/files/GQbygHfo8FlGVPIAf5IZ" alt=""><figcaption></figcaption></figure>

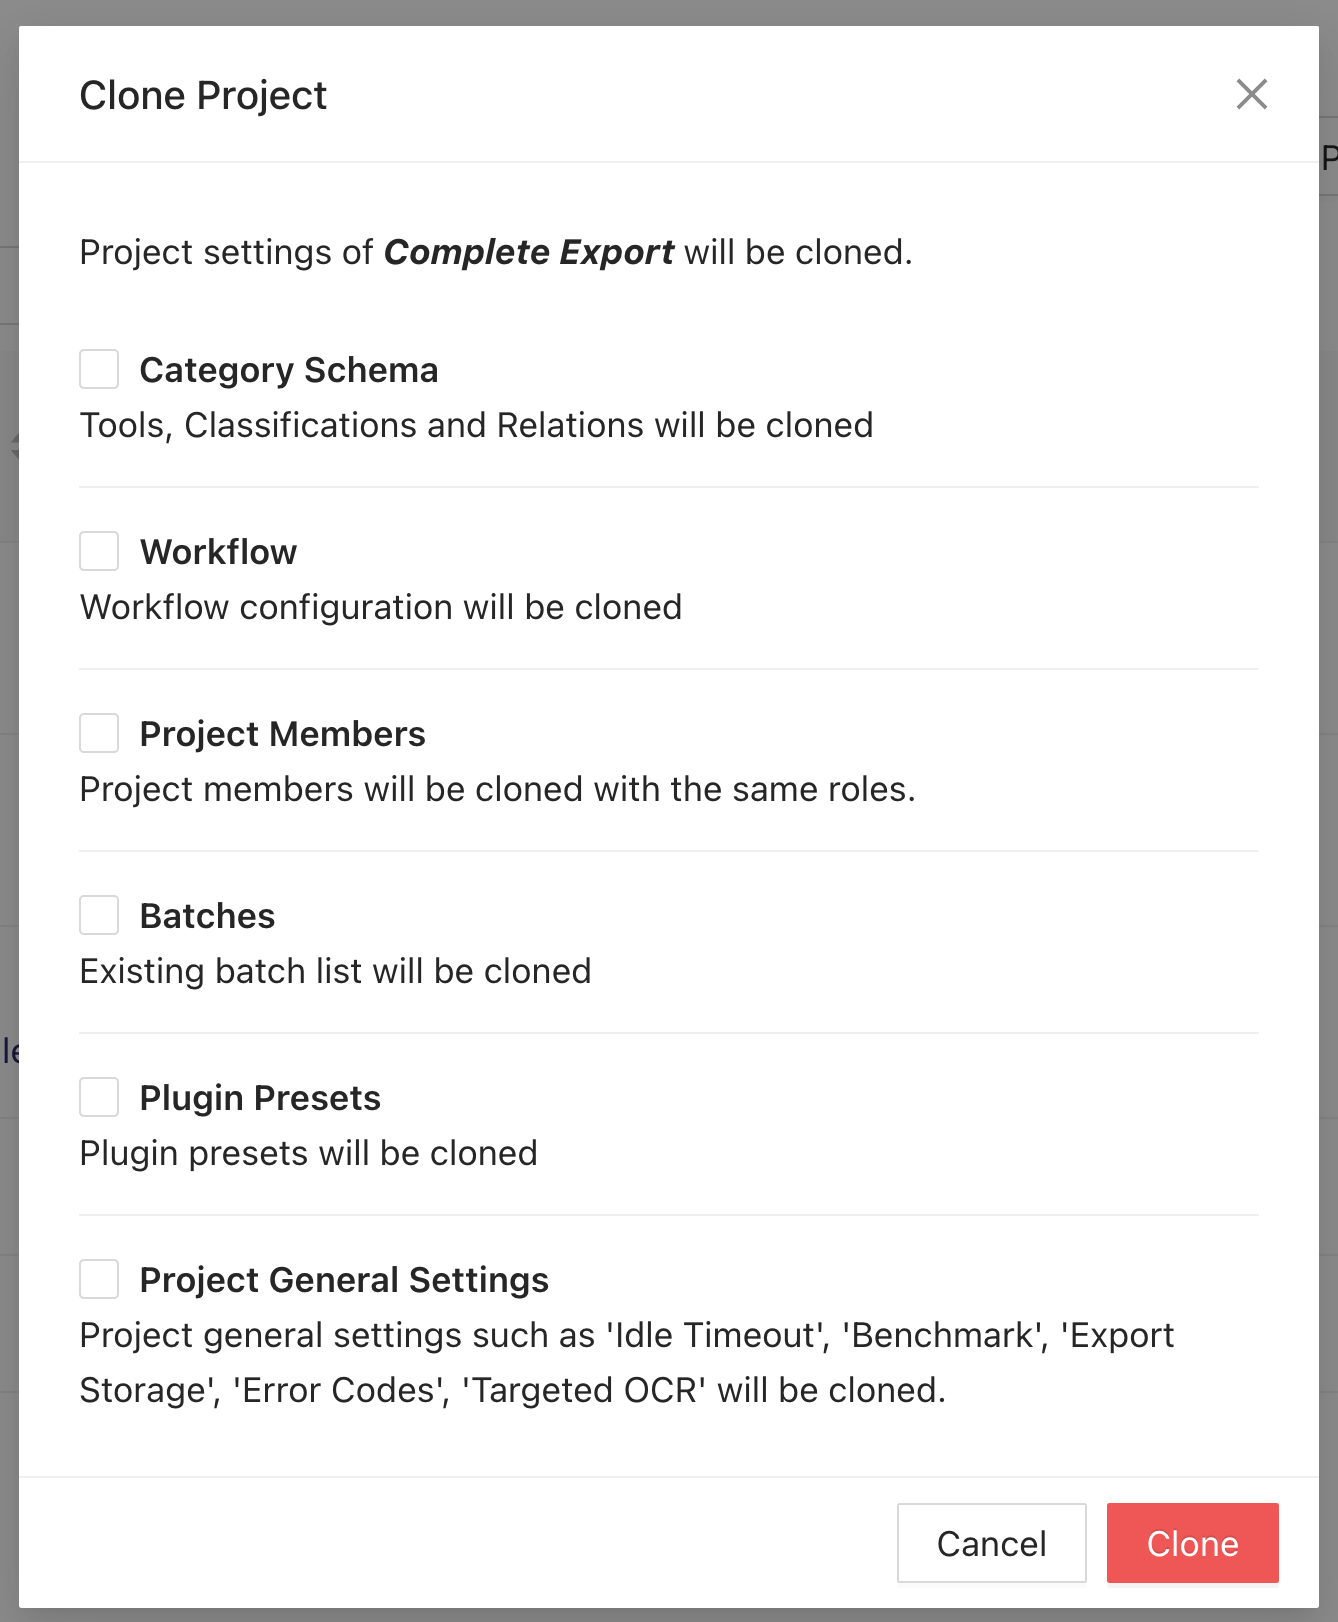
A dialog will appear, allowing you to select what parts of the project you would like to clone:

<figure><img src="/files/DLoaYSTwEOTqhygjFdT3" alt="" width="563"><figcaption></figcaption></figure>

Click on *Clone*. A duplicate of the selected project will be added to your project list.

### Deleting Projects <a href="#deleting-projects" id="deleting-projects"></a>

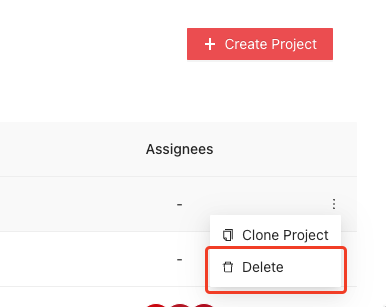
To delete a project, from the *Projects* page, click on the three dots in the same row as the project you wish to delete and click on *Delete*.

{% hint style="danger" %}
Deleting projects is an irreversible and destructive action. Once a project has been deleted, it cannot be recovered.

There is **no** "Trash" to which recently deleted projects go.
{% endhint %}

<figure><img src="/files/K6oiVrA4m0wrMSI39N2D" alt=""><figcaption></figcaption></figure>